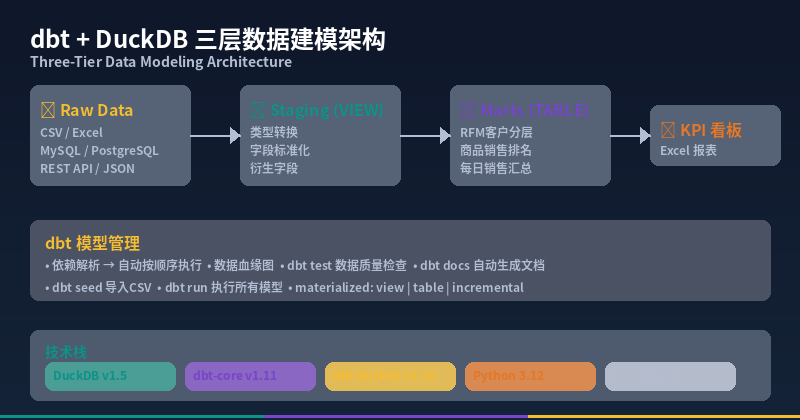
The Problem: Does Every Company Need a ¥100K Data Warehouse?
“Can you build me a data warehouse? I need to see daily sales.”
When you take this gig, the available options seem to be:
- Alibaba Cloud MaxCompute: ¥3,000/month, 1-2 weeks to set up
- Self-hosted Hadoop/Spark: 3 servers + a big data engineer (¥300K+/year)
- Excel + Manual: Free, but 3 hours per report, repeated weekly
There’s a huge gap in the middle — and it’s where 90% of small and medium businesses live.
The reality is: Most SMBs (¥1M ~ ¥50M annual revenue) don’t need a distributed data warehouse. Their data is tens of thousands to a few million rows in CSV/Excel, perfectly runnable on a laptop.
What they actually need:
- Zero software cost — no new monthly bills
- Delivered in half a day — set up today, use tomorrow
- Maintainable and scalable — not a one-off script, a real data engineering architecture
- One-click reporting — management KPIs generated automatically
This is exactly where dbt + DuckDB dominates.
dbt + DuckDB: The Best Data Stack for SMBs
What is dbt?
dbt (data build tool) is the hottest data transformation tool in modern data engineering. Its core philosophy:
Define your data transformation logic in SQL. dbt handles dependency management, execution ordering, documentation, and testing — automatically.
You write SELECT statements (clean data, aggregate, compute business metrics). dbt takes care of:
- Dependency resolution (run model A first, then model B)
- Incremental vs full refresh strategies
- Data lineage visualization (see which models depend on which)
- Automated testing and documentation
Why DuckDB as the Engine?
DuckDB pairs perfectly with dbt for SMB workloads:
| Feature | Snowflake | Spark | DuckDB + dbt |
|---|---|---|---|
| Annual Cost | ¥170K+ | ¥100K+ | ¥0 |
| Setup Time | 2-4 weeks | 4-8 weeks | Half a day |
| Server Required | ✅ Cloud cluster | ✅ Cluster | ❌ A laptop |
| DBA Required | ✅ | ✅ | ❌ You |
| Portability | ❌ Vendor lock-in | ❌ JVM-dependent | ✅ One .duckdb file |
| Learning Curve | Medium | Steep | Low (just need SQL) |
🔧 Full Project: E-Commerce Data Warehouse
Here’s a complete e-commerce data warehouse project — data generation, dbt modeling, and report export — fully executable.
📥 Prerequisites
pip install duckdb dbt-duckdb openpyxl pandas

# Verify dbt installation
dbt --version
# Core: 1.11.x, Plugin: duckdb 1.10.x
📁 Project Structure
day24_dbt_project/
├── dbt_project.yml # dbt project config
├── profiles.yml # DuckDB connection config
├── seeds/ # Raw data (CSV)
│ ├── customers.csv # 200 customers
│ ├── products.csv # 50 products
│ ├── orders.csv # 2,000 orders
│ └── reviews.csv # 1,500 reviews
└── models/
 ├── staging/ # Data cleaning layer (VIEW)
 │ ├── stg_customers.sql
 │ ├── stg_products.sql
 │ ├── stg_orders.sql
 │ └── stg_reviews.sql
 └── marts/ # Business analytics layer (TABLE)
 ├── daily_sales_summary.sql
 ├── product_performance.sql
 ├── customer_analytics.sql
 └── kpi_dashboard.sql
Step 1: Generate Sample Data
Run this Python script to generate realistic e-commerce data:
#!/usr/bin/env python3
"""Generate sample e-commerce data for dbt + DuckDB demo."""
import csv, random, os
from datetime import datetime, timedelta

random.seed(42)
OUTPUT_DIR = os.path.dirname(os.path.abspath(__file__))

NUM_CUSTOMERS = 200
NUM_PRODUCTS = 50
NUM_ORDERS = 2000
NUM_REVIEWS = 1500
START_DATE = datetime(2025, 1, 1)
END_DATE = datetime(2026, 5, 1)

def gen_customers():
 cities = ["Beijing", "Shanghai", "Guangzhou", "Shenzhen", "Hangzhou",
 "Chengdu", "Wuhan", "Nanjing", "Chongqing", "Xi'an"]
 levels = ["Regular", "Silver", "Gold", "Diamond"]
 channels = ["Direct", "Search Engine", "Social Media", "Email", "Ads"]
 rows = []
 for i in range(1, NUM_CUSTOMERS + 1):
 reg_date = START_DATE + timedelta(days=random.randint(0, 400))
 rows.append({"customer_id": i, "name": f"User_{i:04d}",
 "city": random.choice(cities),
 "level": random.choices(levels, weights=[50,30,15,5])[0],
 "channel": random.choice(channels),
 "registration_date": reg_date.strftime("%Y-%m-%d"),
 "is_active": 1 if random.random() > 0.15 else 0})
 return rows

def gen_products():
 categories = ["Electronics", "Clothing", "Food", "Home", "Beauty", "Books"]
 suppliers = ["Supplier_A", "Supplier_B", "Supplier_C", "Supplier_D", "Supplier_E"]
 rows = []
 for i in range(1, NUM_PRODUCTS + 1):
 cost = round(random.uniform(10, 500), 2)
 price = round(cost * random.uniform(1.3, 3.0), 2)
 rows.append({"product_id": i, "product_name": f"Product_{i:04d}",
 "category": random.choice(categories), "supplier": random.choice(suppliers),
 "cost": cost, "price": price, "stock": random.randint(0, 1000),
 "shelf_date": (START_DATE + timedelta(days=random.randint(0, 480))).strftime("%Y-%m-%d")})
 return rows

def gen_orders():
 statuses = ["Completed", "Shipped", "Cancelled", "Refunding"]
 payments = ["WeChat Pay", "Alipay", "Bank Card", "COD"]
 rows = []
 for i in range(1, NUM_ORDERS + 1):
 order_date = START_DATE + timedelta(days=random.randint(0, (END_DATE - START_DATE).days - 1))
 quantity = random.randint(1, 5)
 unit_price = round(random.uniform(20, 800), 2)
 rows.append({"order_id": i, "customer_id": random.randint(1, NUM_CUSTOMERS),
 "product_id": random.randint(1, NUM_PRODUCTS),
 "order_date": order_date.strftime("%Y-%m-%d %H:%M:%S"),
 "quantity": quantity, "unit_price": unit_price,
 "total_amount": round(unit_price * quantity, 2),
 "status": random.choices(statuses, weights=[60,20,15,5])[0],
 "payment_method": random.choice(payments)})
 return rows

def gen_reviews():
 rows = []
 for i in range(1, NUM_REVIEWS + 1):
 review_date = START_DATE + timedelta(days=random.randint(0, (END_DATE - START_DATE).days - 1))
 rows.append({"review_id": i, "order_id": random.randint(1, NUM_ORDERS),
 "product_id": random.randint(1, NUM_PRODUCTS),
 "customer_id": random.randint(1, NUM_CUSTOMERS),
 "rating": random.choices([5,4,3,2,1], weights=[40,30,15,10,5])[0],
 "review_date": review_date.strftime("%Y-%m-%d"),
 "is_verified_purchase": 1 if random.random() > 0.3 else 0})
 return rows

# Write CSV files
os.makedirs(os.path.join(OUTPUT_DIR, "seeds"), exist_ok=True)
for name, gen_fn in [("customers", gen_customers), ("products", gen_products),
 ("orders", gen_orders), ("reviews", gen_reviews)]:
 rows = gen_fn()
 path = os.path.join(OUTPUT_DIR, "seeds", f"{name}.csv")
 with open(path, "w", newline="", encoding="utf-8") as f:
 writer = csv.DictWriter(f, fieldnames=rows[0].keys())
 writer.writeheader(); writer.writerows(rows)
 print(f"✅ Generated {path} ({len(rows)} rows)")
Step 2: Configure dbt Project
dbt_project.yml
name: 'duckdb_shop'
version: '1.0.0'
config-version: 2
profile: 'duckdb_shop'

model-paths: ["models"]
seed-paths: ["seeds"]
test-paths: ["tests"]

models:
 duckdb_shop:
 staging:
 +materialized: view # Cleaning layer — views save disk space
 +schema: staging
 marts:
 +materialized: table # Analytics layer — tables for speed
 +schema: marts

seeds:
 duckdb_shop:
 +schema: raw
profiles.yml
duckdb_shop:
 target: dev
 outputs:
 dev:
 type: duckdb
 path: duckdb_shop.duckdb
 schema: main
 threads: 4
Step 3: Write dbt Models (Three-Tier Architecture)
Tier 1: Staging — Raw Data Cleaning
Staging models clean, type-cast, and standardize raw CSV data. Materialized as VIEWs (zero storage).
models/staging/stg_customers.sql
-- Clean customer data: standardize fields and cast types
with source as (
 select * from {{ ref('customers') }}
),
cleaned as (
 select
 customer_id, name as customer_name, city,
 case
 when level in ('Regular', 'Silver', 'Gold', 'Diamond') then level
 else 'Regular'
 end as customer_level,
 channel as acquisition_channel,
 registration_date::date as registration_date,
 is_active::boolean as is_active,
 current_timestamp as loaded_at
 from source
)
select * from cleaned
models/staging/stg_orders.sql
-- Clean orders: parse timestamps, add derived fields
with source as (
 select * from {{ ref('orders') }}
),
cleaned as (
 select
 order_id, customer_id, product_id,
 order_date::timestamp as order_timestamp,
 order_date::date as order_date,
 strftime(order_date::timestamp, '%Y') as order_year,
 strftime(order_date::timestamp, '%m') as order_month,
 strftime(order_date::timestamp, '%Y-%m') as order_year_month,
 strftime(order_date::timestamp, '%u') as order_week,
 quantity, unit_price, total_amount,
 status as order_status, payment_method,
 case
 when status in ('Completed', 'Shipped') then 'valid'
 else 'invalid'
 end as is_valid_order,
 current_timestamp as loaded_at
 from source
)
select * from cleaned
models/staging/stg_products.sql
-- Clean products: compute gross margin, stock status
with source as (
 select * from {{ ref('products') }}
),
cleaned as (
 select
 product_id, product_name, category, supplier,
 cost, price,
 round((price - cost) / nullif(price, 0) * 100, 2) as gross_margin_pct,
 stock, shelf_date::date as shelf_date,
 case
 when stock = 0 then 'Out of Stock'
 when stock < 50 then 'Low Stock'
 when stock < 200 then 'Normal'
 else 'Well Stocked'
 end as stock_status,
 current_timestamp as loaded_at
 from source
)
select * from cleaned
Tier 2: Marts — Business Analytics Models
Marts aggregate cleaned data into business-ready analytical tables. Materialized as TABLEs for fast queries.
models/marts/customer_analytics.sql — RFM Segmentation
-- RFM customer segmentation: find high-value customers
with orders as (
 select * from {{ ref('stg_orders') }}
 where is_valid_order = 'valid'
),
customers as (
 select * from {{ ref('stg_customers') }}
 where is_active = true
),
customer_metrics as (
 select
 c.customer_id, c.customer_name, c.city,
 c.customer_level, c.acquisition_channel, c.registration_date,
 count(distinct o.order_id) as total_orders,
 sum(o.total_amount) as total_spent,
 avg(o.total_amount) as avg_order_value,
 max(o.order_date) as last_order_date,
 min(o.order_date) as first_order_date,
 datediff('day', max(o.order_date), current_date) as days_since_last_order,
 count(distinct o.product_id) as unique_products_bought
 from customers c
 left join orders o on c.customer_id = o.customer_id
 group by 1, 2, 3, 4, 5, 6
),
rfm as (
 select *,
 -- Recency (1-5)
 case when days_since_last_order <= 30 then 5
 when days_since_last_order <= 90 then 4
 when days_since_last_order <= 180 then 3
 when days_since_last_order <= 365 then 2
 else 1 end as r_score,
 -- Frequency (1-5)
 case when total_orders >= 10 then 5
 when total_orders >= 6 then 4
 when total_orders >= 3 then 3
 when total_orders >= 1 then 2
 else 1 end as f_score,
 -- Monetary (1-5)
 case when total_spent >= 10000 then 5
 when total_spent >= 5000 then 4
 when total_spent >= 2000 then 3
 when total_spent >= 500 then 2
 else 1 end as m_score
 from customer_metrics
)
select *,
 r_score + f_score + m_score as rfm_total,
 case
 when (r_score >= 4 and f_score >= 4 and m_score >= 4) then '⭐ VIP Customer'
 when (r_score >= 4 and f_score >= 4 and m_score >= 2) then 'Growth Customer'
 when (r_score >= 3 and f_score >= 3) then 'Standard Customer'
 when (r_score >= 1 and total_orders > 0) then 'At-Risk Customer'
 else 'Silent Customer'
 end as customer_segment
from rfm order by rfm_total desc
models/marts/kpi_dashboard.sql — Executive Dashboard
-- Core KPIs: one query to generate the management dashboard
with daily_sales as (select * from {{ ref('daily_sales_summary') }}),
orders as (select * from {{ ref('stg_orders') }}),
customer_metrics as (select * from {{ ref('customer_analytics') }})

select 'Total Revenue' as metric_name,
 round(sum(total_revenue), 2) as metric_value, 'CNY' as unit
from daily_sales
union all
select 'Total Orders', count(*), 'orders'
from orders where is_valid_order = 'valid'
union all
select 'Avg Order Value', round(avg(total_amount), 2), 'CNY'
from orders where is_valid_order = 'valid'
union all
select 'Active Customers', count(*), 'people'
from customer_metrics where total_orders > 0
union all
select 'VIP Customers', count(*), 'people'
from customer_metrics where customer_segment = '⭐ VIP Customer'
union all
select 'Avg RFM Score', round(avg(rfm_total), 2), 'points'
from customer_metrics
union all
select 'Gross Margin',
 round(sum(total_profit) / nullif(sum(total_revenue), 0) * 100, 2), '%'
from {{ ref('product_performance') }}
order by metric_name
Step 4: One-Click Run + Excel Export
#!/usr/bin/env python3
"""day24_run_all.py — One-click data modeling + report export"""
import subprocess, duckdb, pandas as pd
from pathlib import Path

PROJECT_DIR = Path("day24_dbt_project")
DB_PATH = PROJECT_DIR / "duckdb_shop.duckdb"

# 1. Run dbt seed (import CSVs into DuckDB)
print("📥 Importing CSV data...")
subprocess.run(["dbt", "seed", "--profiles-dir", str(PROJECT_DIR)],
 cwd=PROJECT_DIR, check=True)

# 2. Run dbt run (execute all models)
print("🔨 Running dbt models...")
subprocess.run(["dbt", "run", "--profiles-dir", str(PROJECT_DIR)],
 cwd=PROJECT_DIR, check=True)

# 3. Connect to DuckDB and export reports
conn = duckdb.connect(str(DB_PATH))

# KPI Dashboard
kpi = conn.execute("""
 SELECT metric_name, metric_value, unit
 FROM main_marts.kpi_dashboard
 WHERE metric_name IN ('Total Revenue','Total Orders',
 'Avg Order Value','Active Customers','Gross Margin')
""").fetchdf()
print("\n📈 KPI Dashboard:")
print(kpi.to_string(index=False))

# Top 10 Products
top_products = conn.execute("""
 SELECT product_name, category, units_sold,
 total_revenue, gross_margin_pct
 FROM main_marts.product_performance
 WHERE units_sold > 0
 ORDER BY total_revenue DESC LIMIT 10
""").fetchdf()

# Customer Segments
segments = conn.execute("""
 SELECT customer_segment, count(*) as cnt,
 round(avg(total_spent),2) as avg_spent
 FROM main_marts.customer_analytics
 GROUP BY customer_segment
""").fetchdf()

# Export to Excel
with pd.ExcelWriter("day24_dbt_report.xlsx", engine='openpyxl') as writer:
 kpi.to_excel(writer, sheet_name='KPI Dashboard', index=False)
 top_products.to_excel(writer, sheet_name='Top Products', index=False)
 segments.to_excel(writer, sheet_name='Customer Segments', index=False)

print(f"\n✅ Report exported: day24_dbt_report.xlsx")
conn.close()
Sample Output
📋 Data Model Overview:
 ✅ main_raw.customers: 200 rows
 ✅ main_raw.orders: 2000 rows
 ✅ main_marts.customer_analytics: 174 rows
 ✅ main_marts.product_performance: 50 rows

📈 KPI Dashboard:
 Total Revenue 1,998,087 CNY
 Total Orders 1,593 orders
 Avg Order Value 1,254 CNY
 Gross Margin 40.73%

👥 Customer Segments:
 ⭐ VIP Customer 95 people avg spend ¥12,135
 Standard Customer 64 people avg spend ¥8,084
 At-Risk Customer 10 people avg spend ¥5,555
🔗 Scaling the Service
Combine with Previously Learned Skills
| Skill | How to Combine with dbt |
|---|---|
| Cross-DB JOINs | ATTACH MySQL/PostgreSQL as dbt sources |
| Pandas Integration | Use Python dbt models for complex cleaning |
| FastAPI API | Build REST API on dbt output for browser-based queries |
| Cron Automation | Schedule daily dbt run + email delivery |
Industry-Specific Variants
- E-commerce: Multi-store dashboard + SKU analysis + competitor price tracking
- Restaurant: Ingredient cost analysis + dish margin ranking + peak hour analysis
- Logistics: Delivery time analytics + anomaly detection + driver performance
- Manufacturing: Production capacity + yield rate tracking + supply chain management
The dbt Ecosystem Opportunity
dbt is the fastest-growing tool in data engineering. Adding dbt + DuckDB to your toolkit opens up:
- Freelance dbt modeling gigs on Upwork/Fiverr — ¥3,000-5,000/project
- Excel-to-dbt migration consulting — ¥5,000-10,000/project
- dbt training courses on knowledge platforms
- Corporate dbt + DuckDB training — ¥3,000-5,000/day
Summary
dbt + DuckDB is the optimal data warehousing solution for small and medium businesses. It enables any SQL-capable developer to build a production-grade data warehouse in half a day, for less than 1/10th the cost of traditional solutions.
Your new skill package includes:
- ✅ Three-tier data modeling architecture (Staging → Marts → Dashboard)
- ✅ dbt project configuration and model authoring
- ✅ RFM customer segmentation analytics
- ✅ One-click report export (Python + DuckDB + Excel)
- ✅ Complete framework and delivery process
Next steps: Save this project template. Next time a client asks “Can you build a data warehouse?” — your answer is: “Yes, ¥8,000, and it’s running by the end of the day.”
All code verified on DuckDB v1.5.2, dbt-core v1.11.11, dbt-duckdb v1.10.1, Python 3.12
本文信息
| 项目 | 内容 |
|---|---|
| DuckDB 版本 | v1.5.x(部分功能基于 v2.0 Preview) |
| 最后验证 | 2026-09-12 |
| 测试环境 | Linux / x86_64 / 16GB RAM |
| 官方文档 | DuckDB Documentation |
| GitHub | pengzz9527/duckdb-blog |
如发现错误,欢迎通过 GitHub Issue 或邮件 [email protected] 反馈。