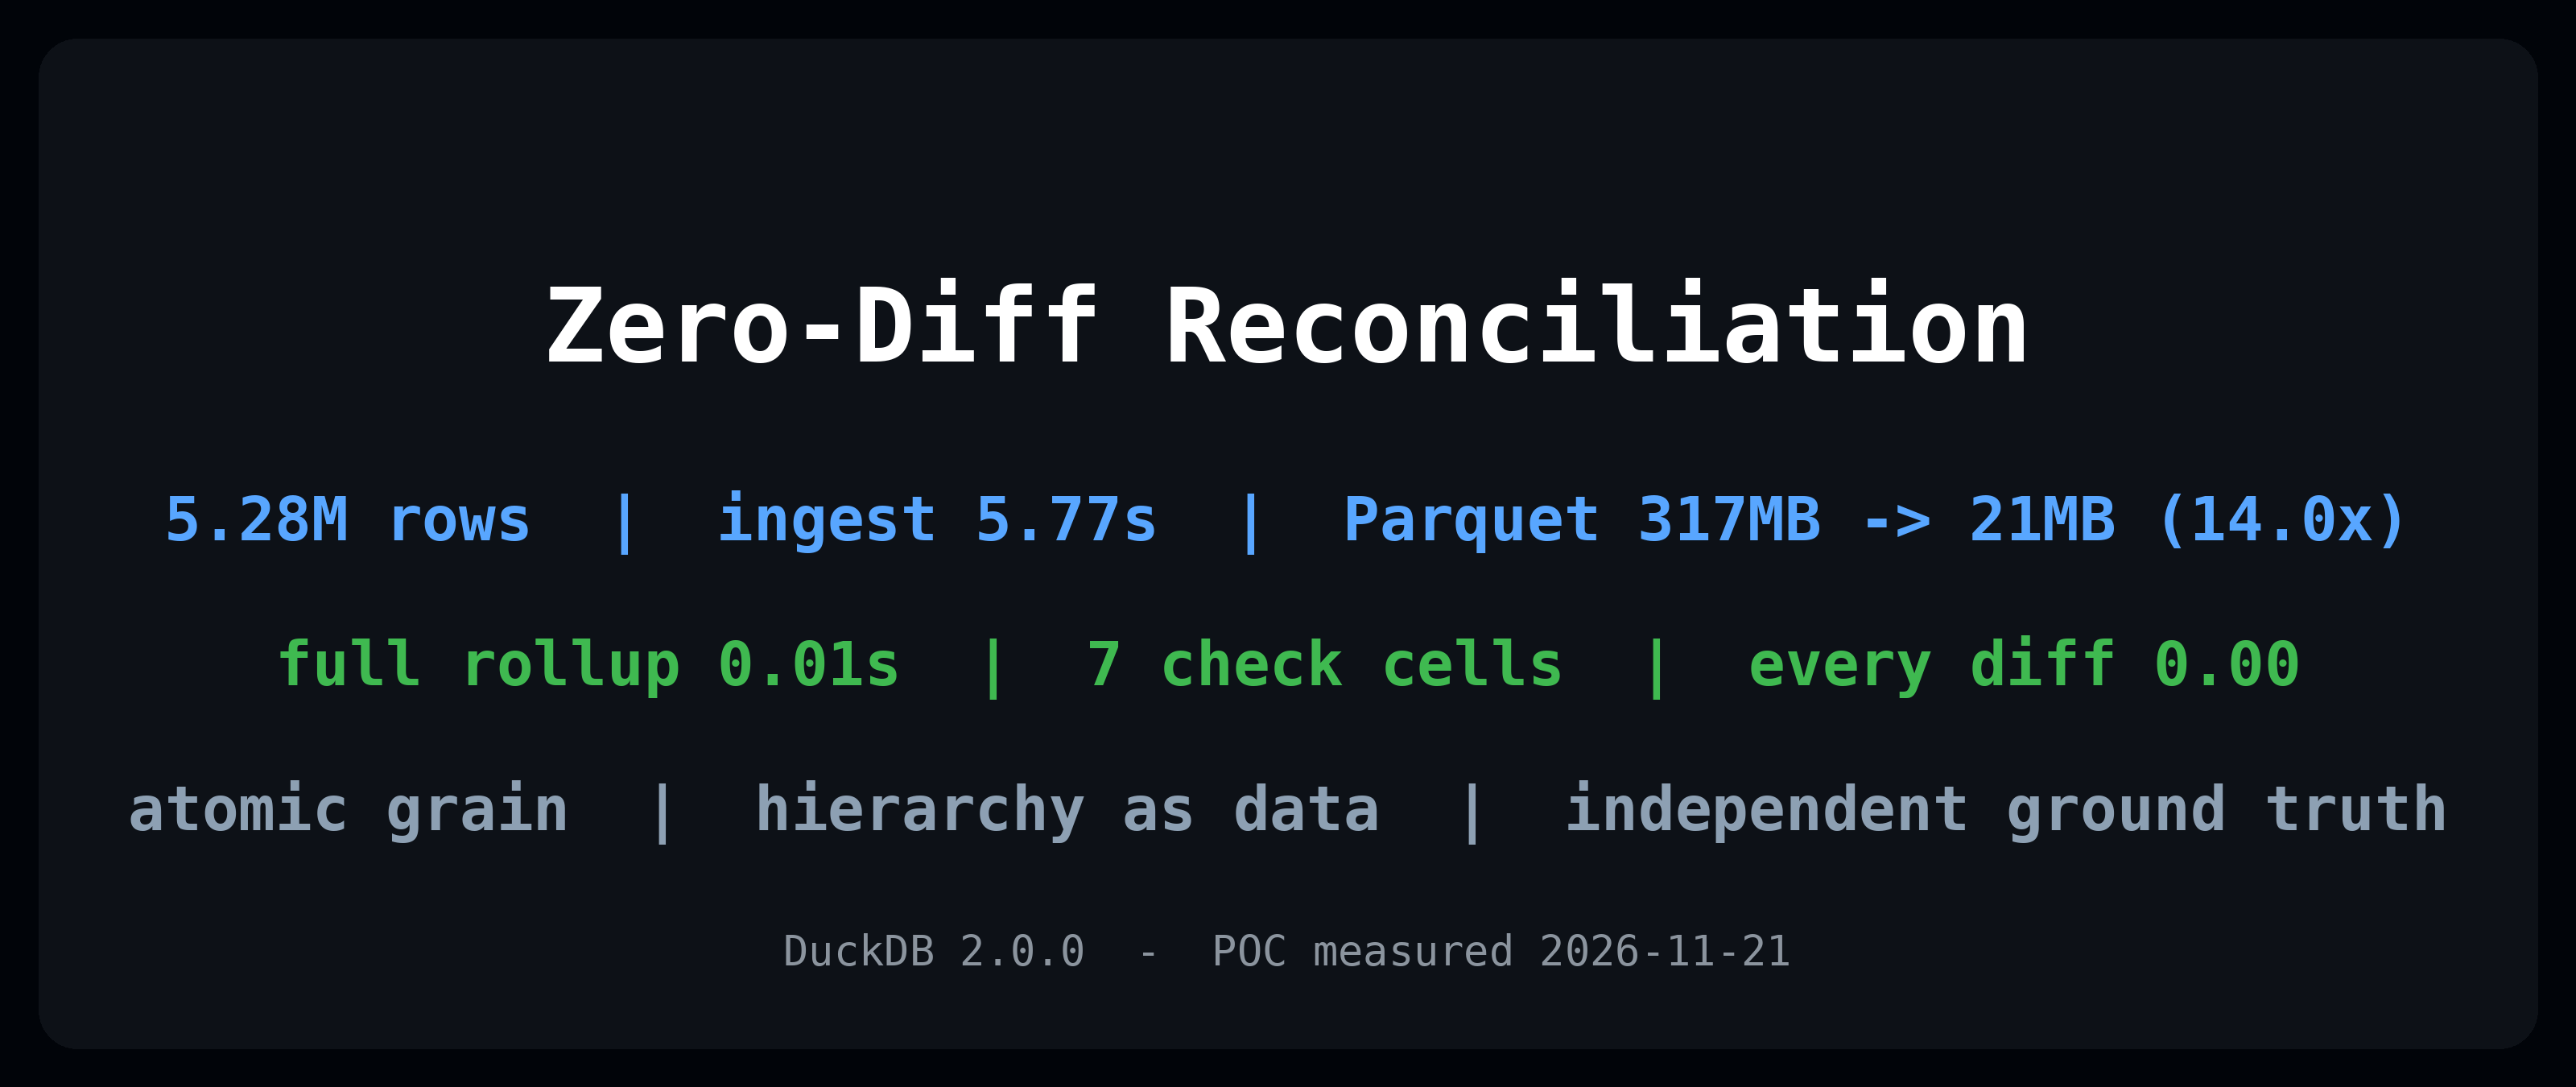
Environment: DuckDB v2.0.0 (Python). Every timing and every aggregate below is an unedited measured output from a two-part POC: a synthetic Essbase-shaped dataset (Sample Basic outline, 17,068 level-0 rows) and a scaled variant (5,281,142 rows, 317 MB export). The data is synthetic with independently generated ground truth; the pipeline, the semantics, and the timings are real. The application side of this POC is documented in our Essbase x DuckDB pipeline article. This piece is the method, generalized so it applies to any system of record you pull offline.
The question nobody asks
When a team copies enterprise data into DuckDB for offline analysis — a cube export, an ERP extract, a warehouse pull — the reflex is to benchmark: ingest time, Parquet size, query latency. And those numbers matter. But speed is not the risk.
The risk is a silent misalignment: one hierarchy edge dropped in the export, a shared member that double-counts into a total, a scenario filter that quietly excludes half the data. And because the copy answers faster than the original system ever did, nobody notices. Wrong answers just arrive on time.
The zero-diff method exists to answer the only question that actually matters:
Can you prove the replica matches the system of record, cell by cell, with a difference of exactly zero — and when it is not zero, can you locate the difference to the precise members and scenario that caused it?
A difference of zero is provably zero. A real difference is locatable. Everything else is a guess.
The five principles
- Export at the atomic grain. Verify with the finest stored data — level-0 / leaf members, full member intersections. An aggregated pull cannot be drilled down; when an aggregate is off, you cannot tell why.
- Hierarchy is data. In a cube, rollups follow the outline. In SQL, the outline becomes tables. Every rollup is a join plus a GROUP BY, and semantics follow the data instead of a black box.
- Independent ground truth. The check has to come from a different code path than the replica — the source system’s own reports, or a ground truth generated independently from the raw export. A replica grading itself proves nothing.
- The zero-diff bar. Every check cell must tie out to exactly zero. Not “within rounding.” A difference of 0.004 is a difference, and it gets localized like any other.
- Separate semantics from throughput. Prove correctness on a small sample first, then prove scale. They are different failure classes and need different tests.
Step 1 — Atomic export, no import program
The source side writes its finest stored grain to a flat file: in Essbase, a DATAEXPORT calc script (or MaxL) emits one full member intersection plus its value per line. The DuckDB side has no import program at all — read_csv turns the text into a table, with quote character and delimiter as parameters:
CREATE TABLE fact AS
SELECT * FROM read_csv('basic_level0.txt', header = false, sep = ' ', quote = '"',
  columns = {'Month':'VARCHAR', 'Measures':'VARCHAR', 'Product':'VARCHAR',
             'Market':'VARCHAR', 'Scenario':'VARCHAR', 'Value':'DOUBLE'});
-- 17,068 rows, 0.04 s measured
That is the entire ingest. Atomic grain, one file, zero tooling.
Step 2 — Hierarchy as data
A fact table alone cannot reproduce cube semantics, because rollups follow the outline hierarchy. The move is to make the hierarchy into data — two small tables:
product_hier(member, parent, rollup)   -- the `rollup` column is the subtle one
market_hier(member, parent)
The rollup column exists because of alternate rollups: in Sample Basic, products 100-20, 200-20 and 300-30 belong to their primary categories and roll up once more under “Diet”. A member simply appears twice in the hierarchy table, and any rollup becomes a join plus a GROUP BY:
SELECT h.parent AS category, sum(f.Value) AS sales
FROM fact f
JOIN product_hier h ON h.member = f.Product AND h.rollup = 'primary'
WHERE f.Measures = 'Sales' AND f.Scenario = 'Actual'
GROUP BY 1 ORDER BY 1;
One rule carries the whole design: never let an alternate rollup leak into the primary chain, or totals get double-counted — the same discipline as keeping stored and shared members straight inside the cube.
Step 3 — Ground truth and the zero-diff bar
Now the check itself. Every check cell is an aggregate the source system can also produce, computed on two independent paths and diffed:
| Check cell | DuckDB replica | Difference vs. ground truth |
|---|---|---|
| Category 100 (primary rollup) | 1,745,240.44 | 0.00 |
| Category 200 | 2,558,852.13 | 0.00 |
| Category 300 | 1,883,168.76 | 0.00 |
| Category 400 | 1,869,248.40 | 0.00 |
| Overall Sales total | 8,056,509.73 | 0.00 |
| Diet (alternate rollup) | 1,782,909.84 | 0.00 |
| Profit (formula member, recomputed in SQL) | 2,152,890.95 | 0.00 |
Seven cells, two of them in the specialty territory (an alternate rollup and a formula member), all at exactly zero. That step is the credibility foundation of the whole route: once the semantics tie out, everything downstream is trustworthy.
When a cell does not tie, the method has a standing query: drill from the failed aggregate to the level-0 intersections that compose it.
-- failed cell: California / Actual / Sales
SELECT Month, Measures, Product, Scenario, Value
FROM fact WHERE Market = 'California' AND Scenario = 'Actual' AND Measures = 'Sales';
The drill-down always terminates at concrete members. A difference that localizes is a difference you can fix; one that cannot is an export problem, and that is also known — which is the point.
Step 4 — The failure modes, and their locators
From the POC, the failure classes that actually occur, in order of how often they bite:
| Failure mode | Symptom | Locator |
|---|---|---|
| Shared/alternate member leaks into the primary chain | A total is double-counted, clean multiple | List members appearing in both rollup chains: SELECT member, count(DISTINCT rollup) FROM product_hier GROUP BY 1 HAVING count(*) > 1 |
| Formula member absent from the export | A check cell is simply missing, not off | Profit is not stored at level 0; recompute it in SQL (sum(Value * CASE Measures WHEN 'Sales' THEN 1 ELSE -1 END)). Every formula account you rely on needs a maintained SQL definition |
| Scenario omitted from the export | Rollups tie out confidently and completely wrong | SELECT DISTINCT Scenario against the expected set — one missing scenario shifts every total |
| Decimal/format drift | Small, systematic differences on many cells | Max absolute diff per cell; sub-unit differences that are uniform point at formatting, not logic |
Note the second row: formula members mark the semantic boundary of the route. However many formula accounts the source has, that many definitions must be maintained on the SQL side. With a handful, a few CASE expressions; with hundreds, a definition layer — and that layer, not the pipeline, is the real productization cost.
Step 5 — Then scale, separately
Correctness and throughput are tested on different data. The scaled POC adds an Entity dimension with 100 organizations, 200 SKUs, keeps markets at region level: 5,281,142 level-0 rows, a 317 MB export text file. Measured on the same machine:
| Step | Result |
|---|---|
| Ingest export text into DuckDB | 5.77 s |
| Convert to Parquet (ZSTD) | 2.33 s, 317 MB to 21 MB (14.0x) |
| Full rollup (total Sales) | 0.01 s |
| Top-10 organizations by Sales | 0.01 s |
| Actual vs. Budget variance, all products | 0.02 s |
Variance analysis is the most common job in this kind of offline work — in the source it is a dedicated report; here it is one aggregation with FILTER:
SELECT Product,
       sum(Value) FILTER (Scenario = 'Actual')
     - sum(Value) FILTER (Scenario = 'Budget') AS var
FROM fact_scaled WHERE Measures = 'Sales'
GROUP BY 1 ORDER BY abs(var) DESC LIMIT 5;
-- largest variance: SKU-0057, Actual 1,553,495.11 below Budget
The scale pass runs the same zero-diff check family on the bigger export. Throughput proves nothing about correctness, and correctness proves nothing about throughput — that separation is why the method has two distinct passes.
The one-page checklist
- Export at the atomic grain (level 0 / leaf, full member intersections).
- Model the hierarchy as data:
(member, parent, rollup)— withrollupdistinguishing alternate chains. - Generate ground truth on an independent path (source reports, or generated alongside the synthetic data).
- Build the check-cell family: every top-level rollup, every alternate rollup, every formula member you use, and the grand total.
- Enforce the zero-diff bar; any non-zero cell gets the drill-down query and a recorded locator.
- Only then: the scale pass — same checks on a large export, plus ingest / Parquet / query timings.
When not to use the method
- Data with live security semantics. Permissions and meta-read filters do not travel with an export file; the offline copy needs its own masking and access control before it leaves the person who did the export.
- Thousands of formula accounts. The SQL definition layer becomes the maintenance product; the pipeline is only the start of it.
- Write-back expectations. This method proves a read-only copy is true. Entry and official calculation stay in the system of record; the replica is for looking, testing, and diffing — not for writing.
Conclusion
Zero-diff reconciliation is not a test you run once; it is the operating model for any offline copy of authoritative data. Export the atomic grain, make the hierarchy into data, grade against an independent path, hold the zero bar, localize every miss, and keep semantics and scale on separate test benches. Do that and the copy earns trust the way the source already has: by tying out, cell by cell, to exactly zero.
Further Reading
- Essbase x DuckDB: offline analytics for a classic MOLAP cube — the application pipeline this method generalizes from
- DuckDB FTS + BM25 memory recall, hands-on — the same “measure, don’t assume” discipline applied to a different problem
read_csvand Parquet in the DuckDB documentation